Ceph Dashboard及监控 (十)
Ceph dashboard是通过一个 web界面,对已经运行的ceph集群进行状态查看及功能配置等功能,早期ceph使用的是第三方的dashboard组件,如:
**Calamari: **
Calamari 对外提供了十分漂亮的Web管理和监控界面,以及一套改进的REST API接口(不同于Ceph自身的REST API),在一定程度上简化了Ceph的管理,最初Calamari是作为 Inktank公司的Ceph企业级商业产品来销售,红帽2015年收购Inktank 后为了更好地推动Ceph的发展,对外宣布Calamari 开源
https://github.com/ceph/calamari
优点:
- 管理功能好
- 界面友好
- 可以利用它来部署Ceph和监控Ceph
缺点:
- 非官方
- 依赖OpenStack某些包
(ceph@ceph-deploy ceph-cluster]$ ceph-deploy -h
.......
calamari
                         Install and configure Calamari nodes. Assumes that a
                         repository with Calamari packages is already
                         configured. Refer to the docs for examples
                         (http://ceph.com/ceph-deploy/docs/conf.html)
VSM:
Virtual Storage Manager (VSM)是Intel公司研发并且开源的一款Ceph集群管理和监控软件,简化了一些Ceph集群部署的一些步骤, 可以简单的通过 WEB页面来操作.
https://github.com/intel/virtual-storage-manager
优点:
- 易部署
- 轻量级
- 灵活(可以自定义开发功能)
缺点:
- 监控选项少
- 缺乏Ceph管理功能
Inkscope:
Inkscope是一个Ceph的管理和监控系统,依赖于Ceph提供的API,使用MongoDB来存储实时的监控数据和历史信息。
https://github.com/inkscope/inkscope
优点:
- 易部署
- 轻量级
- 灵活(可以自定义开发功能)
缺点:
- 监控选项少
- 缺乏Ceph管理功能
Ceph-Dash:
Ceph-Dash是用 Python 开发的一一个Ceph的监控面板,用来监控Ceph的运行状态。
同时提供REST API来访问状态数据。
http://cephdash.crapworks.de/
优点:
- 易部署
- 轻量级
- 灵活(可以自定义开发功能)
缺点:
- 功能相对简单
10.1 启用dashboard插件
https://docs.ceph.com/en/mimic/mgr/
https://docs.ceph.com/en/latest/mgr/dashboard/
https://packages.debian.org/unstable/ceph-mgr-dashboard #15 版本有依赖需要单独解决
Ceph mgr 是一个多插件(模块化)的组件,其组件可以单独的启用或关闭,以下为在
ceph-deploy服务器操作:
新版本需要安装 dashboard 包,而且必须安装在mgr节点,否则报错如下:
The following packages have unmet dependencies:
ceph-mgr-dashboard : Depends: ceph-mgr (= 15.2.13-1-bpo10+1) but it is not going to
be installed
E: Unable to correct problems, you have held broken packages.

root@ceph-mgr1:~# apt-cache madison ceph-mgr-dashboard
root@ceph-mgr1:~# apt install ceph-mgr-dashboard
[ceph@ceph-deploy ceph-cluster]$ ceph mgr module -h #查看帮助
[ceph@ceph-deploy ceph-cluster|$ ceph mgr module ls #列出所有模块状态
{
    "enabled_modules": [ #已开启的模块
        "balancer",
        "crash",
        "iostat",
        "restful",
        "status"
],
"disabled_modules": [ #已关闭的模块
    {
         "name": "dashboard",
         "can_ run": true, #是否可以启用
         "error string": ""
    },
{
         "name": "hello",
         "can_run": true,
         "error_string":""
},
------
[ceph@ceph-deploy ceph-cluster]$ ceph mgr module enable dashboard #启用模块
注:模块启用后还不能直接访问,需要配置关闭SSL或启用SSL及指定监听地址.
10.1.2 启用dashboard模块
Ceph dashboard在mgr节点进行开启设置,并且可以配置开启或者关闭SSL,如下:
[ceph@ceph-deploy ceph-cluster]$ ceph config set mgr mgr/dashboard/ssl false #关闭mgr SSL
[ceph@ceph-deploy ceph-clusterl$ ceph config set mgr mgr/dashboard/ceph-mgr1/server_addr 172.31.6.107 #指定dashboard监听地址
[ceph@ceph-deploy ceph-cluster]$ ceph config set mgr mgr/dashboard/ceph-mgr1/server_port 9009 #指定dashboard监听端口


#验证ceph集群状态:
(ceph@ceph-deploy ceph-cluster]$ ceph -s
cluster:
  id: 23b0f9f2-8db3-477f-99a7-35a90eaf3dab
  health: HEALTH_ OK

services:
  mon: 3 daemons, quorum ceph-mon1 ,ceph-mon2,ceph-mon3
  mgr: ceph-mgr1(active), standbys: ceph-mgr2
  mds: mycephfs-2/2/2 up {0=ceph-mgr1=up:active, 1=ceph-mgr2=upactive}, 1
up:standby
osd: 12 osds: 12 up, 12 in


如果有以下报错:
Module 'dashboard' has failed: error("No socket could be created',)

需要检查mgr服务是否正常运行,可以重启一遍mgr服务
10.1.3 在mgr节点验证端口与进程
[root@ceph-mgr1 ~]# lsof -i:9009
COMMAND  PID USER  FD  TYPE DEVICE SIZE/OFF NODE NAME
ceph-mgr 2338 ceph  28u  IPv4 23986 OtO TCP *:pichat (LISTEN)
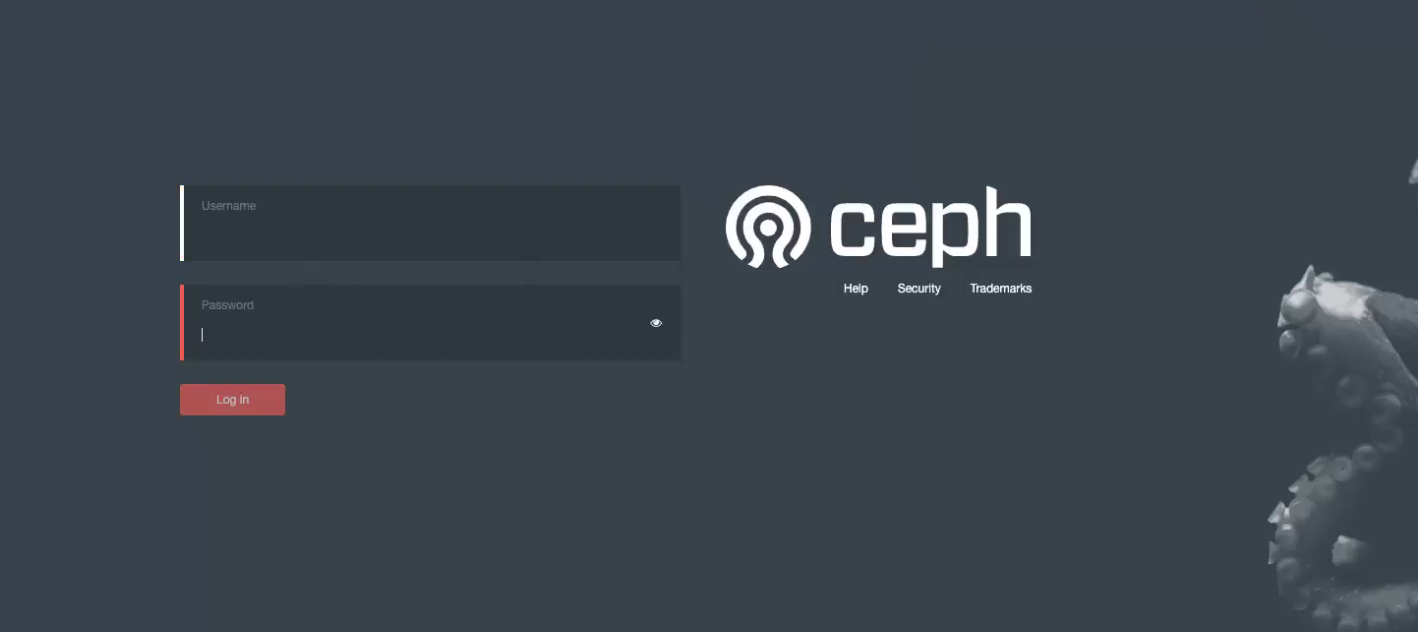
10.1.4 dashboard访问验证
10.1.5 设置dashboard账户及密码
Ubuntu:
ceph@ceph-deploy:/home/ceph/ceph-clustqr$ touch pass.txt
ceph@ceph-deploy:/home/ceph/ceph-cluster$ echo "12345678" > pass.txt
ceph@ceph-deploy:/home/ceph/ceph-cluster$ ceph dashboard set-login-credentials jack -i pass.txt

********************************************************************************
***WARNING: this command is deprecated.
*** Please use the ac-user-* related commands to manage users. ***
********************************************************************************
Username and password updated
早期方式:
[ceph@ceph-deploy ceph-cluster]$ ceph dashboard set-login-credentials -h #命令格式
Monitor commands:
====================
Dashboard  set-login-credentials  <username>  <password>
Set the login credentials

[ceph@ceph-deploy ceph-cluster]$ ceph dashboard set-login-credentials jack 123456
Username and password updated #设置jack用户密码为123456
10.1.7 dashboard SSL
如果要使用SSL访问。则需要配置签名证书.证书可以使用ceph命令生成,或是opessl
命令生成.
https://docs.ceph.com/en/latest/mgr/dashboard/
10.1.7.1 ceph自签名证书
#生成证书:
[ceph@ceph-deploy ceph-cluster]$ ceph dashboard create-self-signed-cert
#启用SSL:
[ceph@ceph-deploy ceph-cluster]$ ceph config set mgr mgr/dashboard/ssl true

#查看当前dashboard状态:
[ceph@ceph-deploy ceph-cluster]$ ceph mgr services
{
"dashboard": "http://172.31.6.107:9009/"
}


#重启mgr服务:
[root@ceph-mgr1 ~]# systemctl restart ceph-mgr@ceph-mgr1

#再次验证dashboard:
[ceph@ceph-deploy ceph-cluster}$ ceph mgr services
{
"dashboard": "https://172.31.6.107:9009/"
}
10.1.7.2 验证证书信息
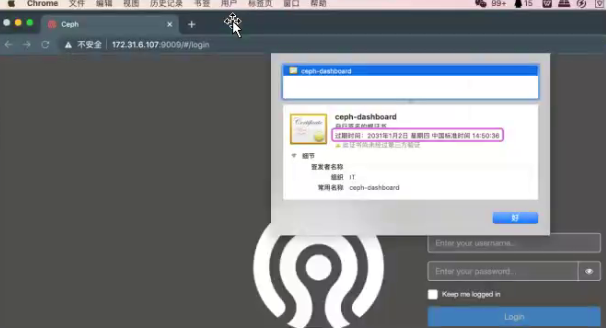
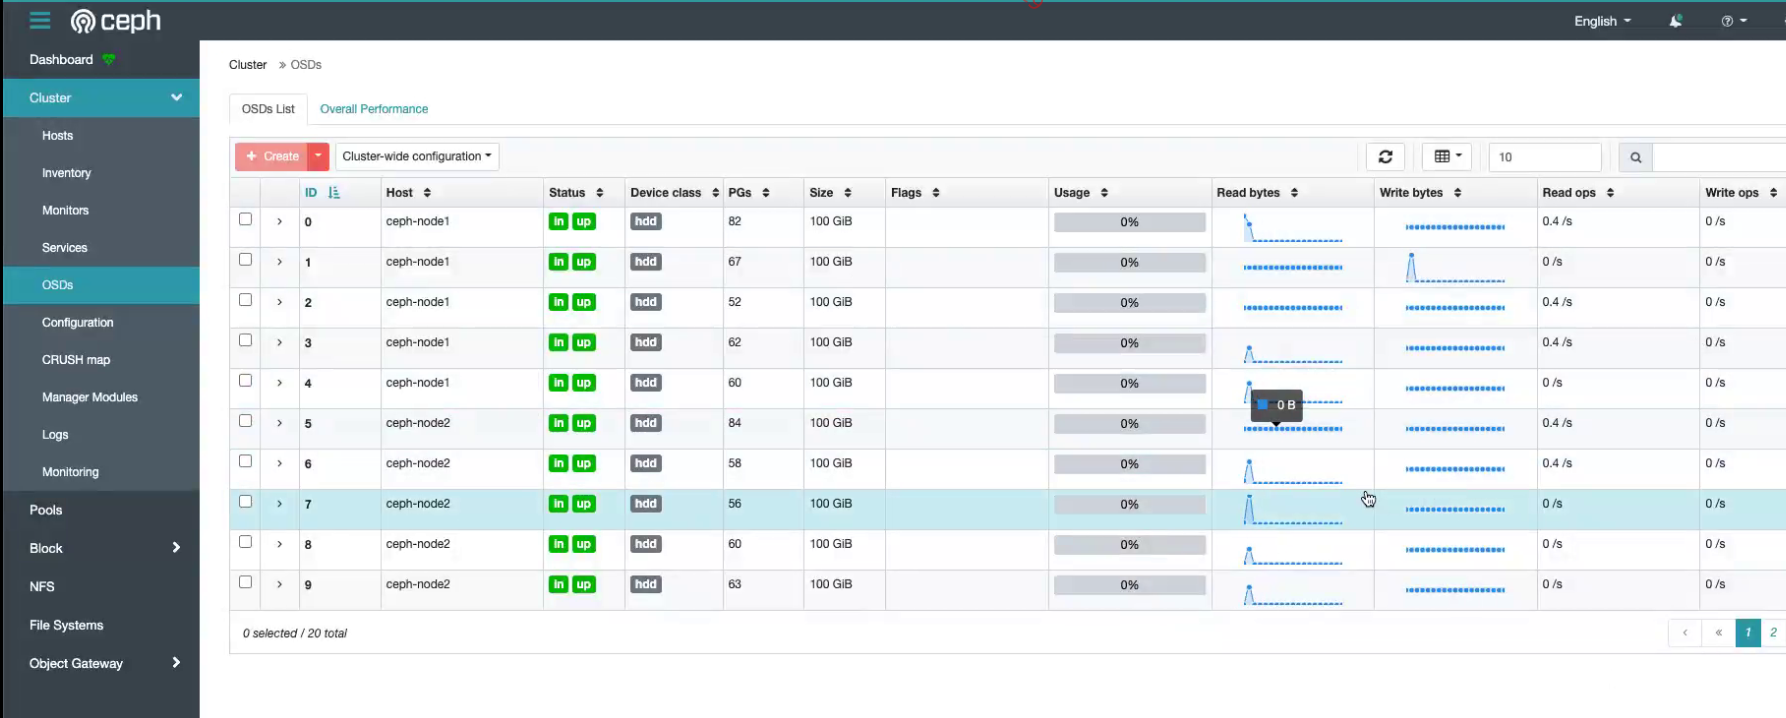
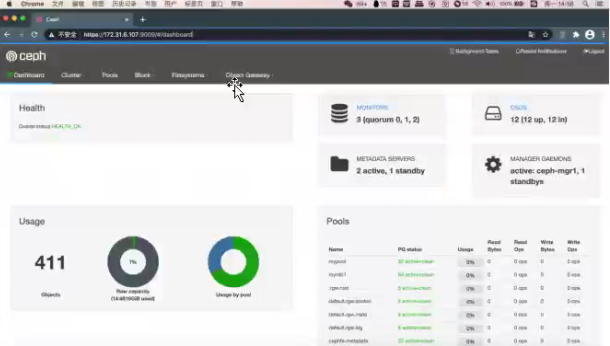
10.1.7.4 登陆成功
10.2 通过prometheus监控ceph node节点
10.2.1 部署prometheus
[root@ceph-mgr1 ~]# mkdir /apps
[root@ceph-mgr1 ~]# cd /apps/
root@ceph-mgr1 apps]# tar xvf prometheus-2.27.1.linux-amd64.tar.gz
[root@ceph-mgr1 apps]# ln -sv /apps/prometheus-2.27.1.linux-amd64 /apps/prometheus
'/apps/prometheus’->' /apps/ prometheus-2.27.1.linux-amd64'
[root@ceph-node1 prometheus]# cat /etc/systemd/system/prometheus.service
[Unit]
Description=Prometheus Server
Documentation=https://prometheus.io/docs/introduction/overview/
After=network.target

[Service]
Restart=on-failure
WorkingDirectory=/apps/prometheus/
ExecStart=/apps/prometheus/prometheus
--config.file=/apps/prometheus/prometheus.yml

[Istall]
WantedBy=multi-user.target


root@ceph-mgr1 apps]# systemctl daemon-reload
root@ceph-mgr1 apps]# systemctl restart prometheus
root@ceph-mgr1 apps]# systemctl enable prometheus
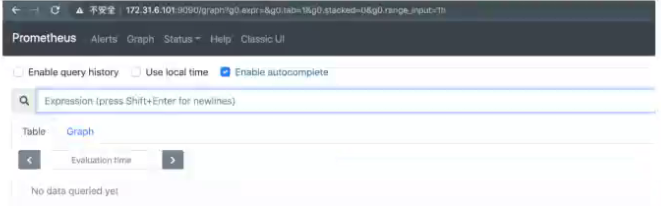
10.2.2 访问prometheus
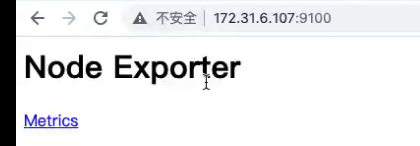
10.2.3 部署node_exporter
各node节点安装node_exporter
[root@ceph-node1 ~]# mkdir /apps
[root@ceph-node1 ~]# cd /apps/

[root@ceph-node1 apps]# tar xvf node_exporter-1.0.1.inux. amd64.tar.gz
root@ceph-node1 apps]# ln -sv /apps/node_exporter-1.0.1.linux -amd64 /apps/node_exporter


rootaceph-node1:/apps# scp node_exporter-1.0.1.linux-amd64.tar.gz 172.31.6.107:/apps/
[root@ceph-node2 apps]# cat /etc/systemd/system/node-exporter.service
[Unit]
Description=Prometheus Node Exporter
After-network.target
[Service]
ExecStart=/apps/node_exporter/node_exporter
[Instal]
WantedBy=multi-user.target

root@ceph-node1 apps]# systemctl daemon-reload
[root@ceph-node1 apps]# systemctl restart node-exporter
[root@ceph-node1 apps]# svstemctl enable node-exporter
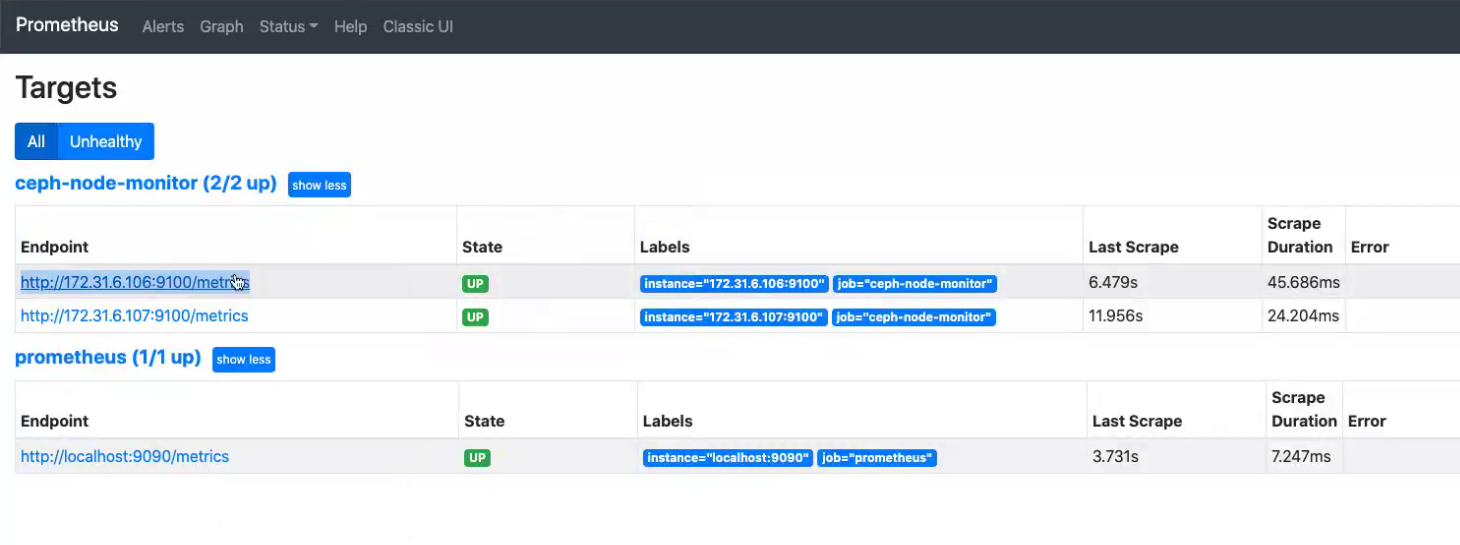
10.2.4 配置prometheus server数据并验证
vim /apps/prometheus-2.23.0.linux-amd64/prometheus.yaml
scrape configs :
# The job name is added as a Label. job=<job_ name> to any timeseries scraped from this config.

- job_name: 'prometheus'

  # metrics_path defaults to ' /metrics'
  # scheme defaults to 'http'.

  static_configs:
  - targets: ['localhost:9090']

- job_name: 'ceph-node monitor'
  static_configs:
  - targets: ['172.31.6.106:9100','172.31.6.107:9100']
10.3 通过prometheus监控ceph服务
Ceph manager内部的模块中包含了prometheus 的监控模块,并监听在每个 manager 节点的9283端口,该端口用于将采集到的信息通过 http接口向prometheus 提供数据.
https://docs.ceph.com/en/mimic/mgr/prometheus/?highlight=prometheus
10.3.1 启用 prometheus 监控模块
[ceph@ceph-deploy ceph-cluster]$ ceph mgr module enable prometheus
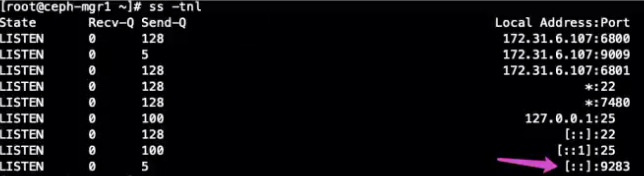
10.3.2 验证manager 数据
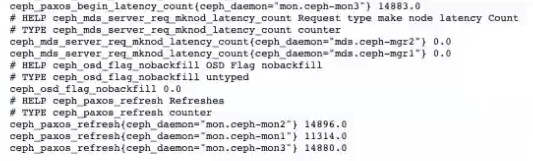
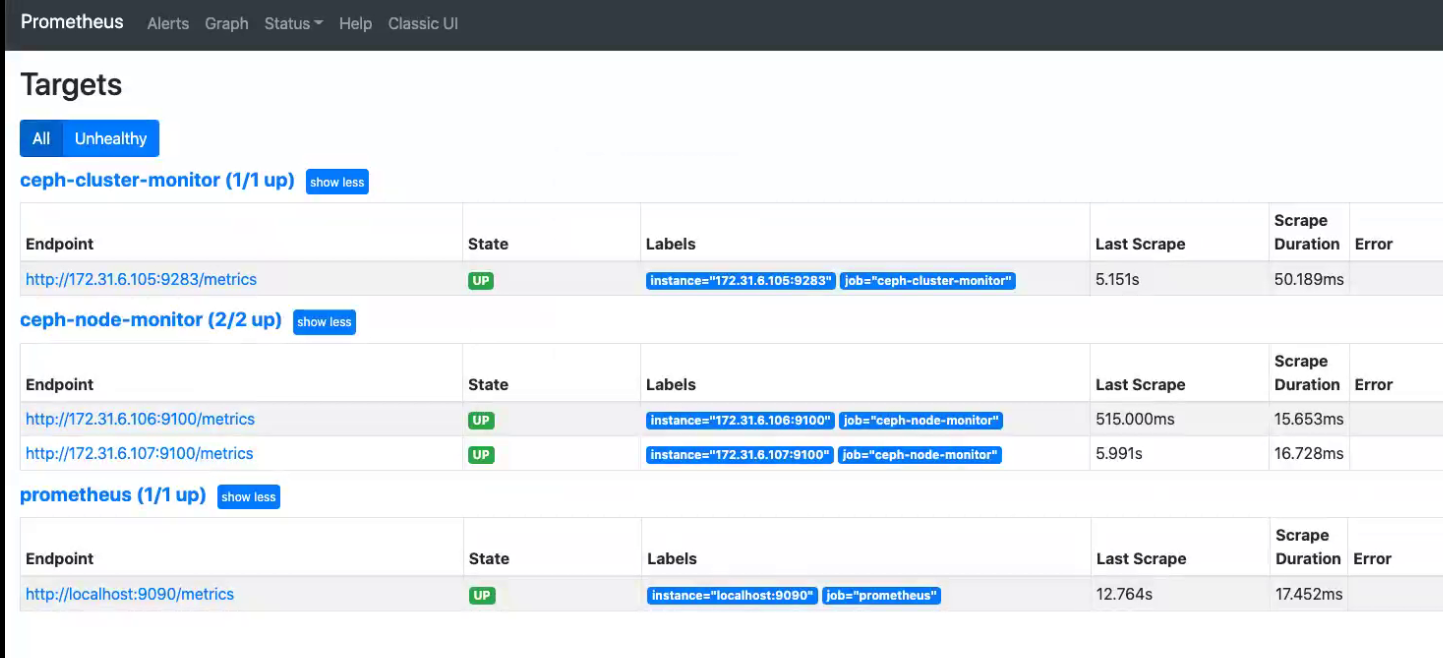
10.3.3 配置Prometheus 采集数据
vim /apps/prometheus-2.23.0.linux-amd64/prometheus.yaml
- job_name: 'ceph-cluster-monitor'
  static_configs:
  - targets:['172.31.6.105:9283']

systemctl restart prometheus.service
10.3.4 验证数据
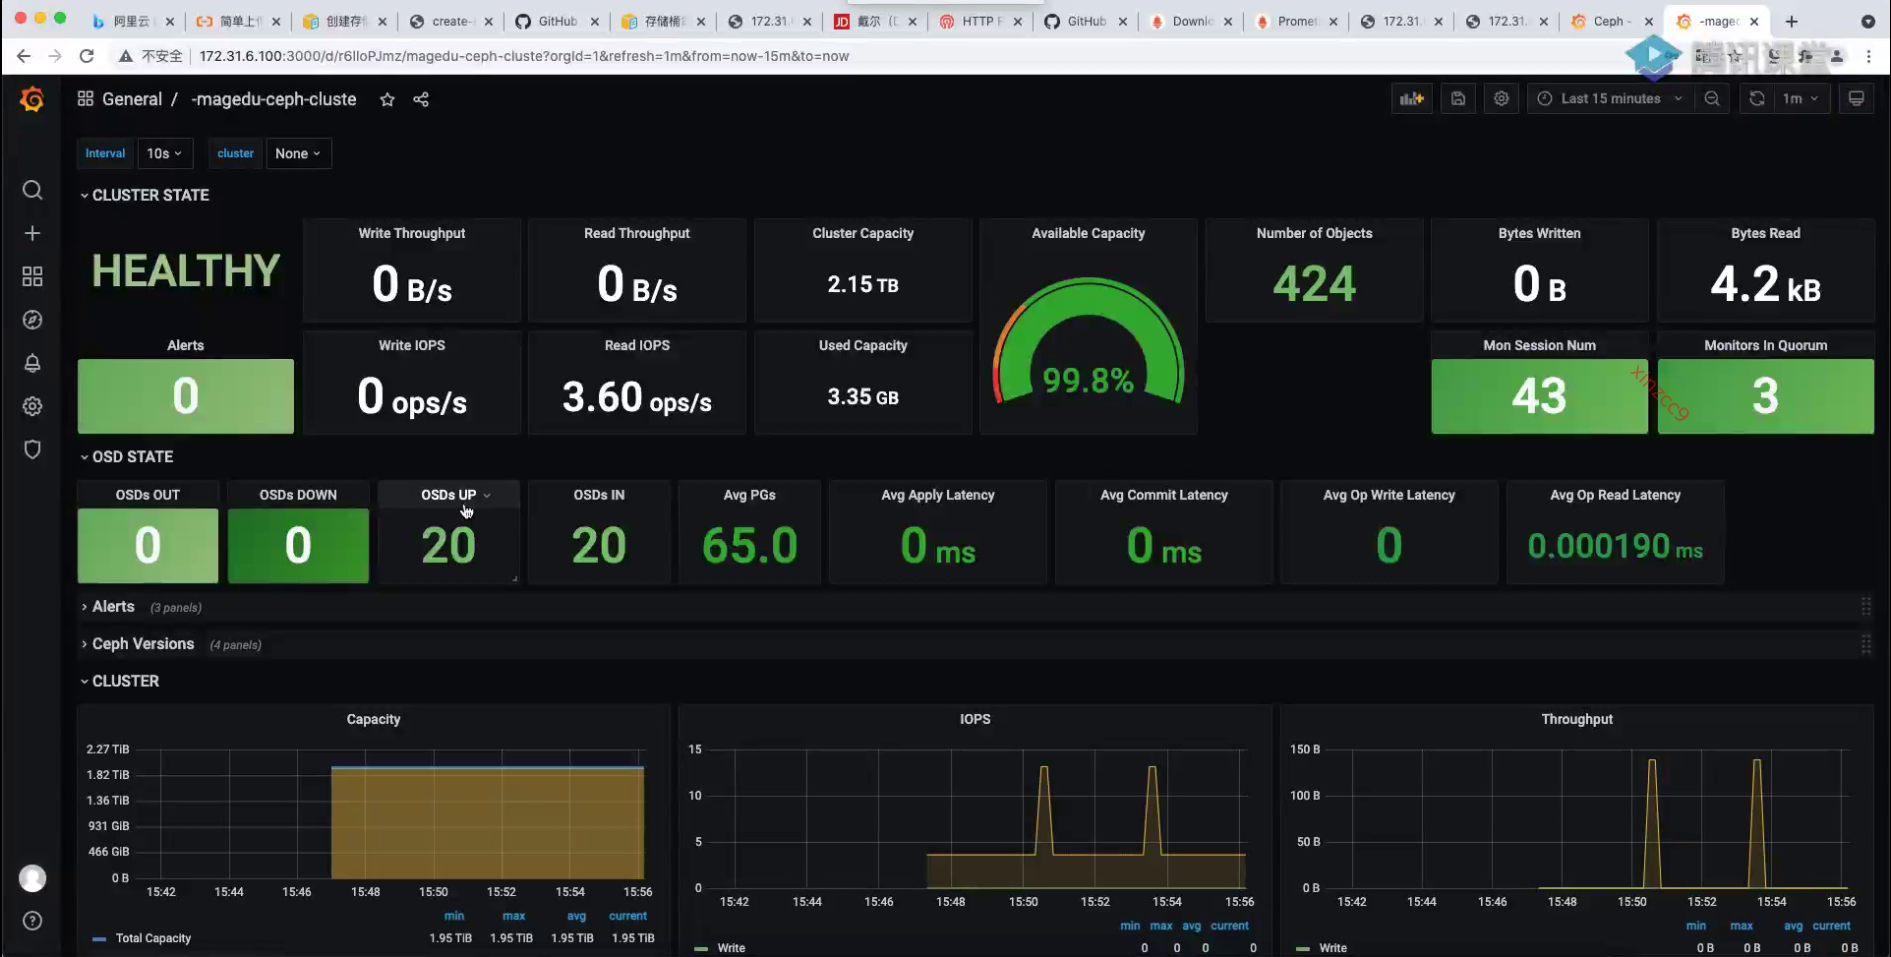
10.4 通过grafana显示监控数据
通过granfana 显示对ceph的集群监控数据及node 数据.
10.4.1 安装grafana
[root@ceph-mgr1 apps]# yum localinstall grafana-7.5.7-1.x86_64.rpm
[root@ceph-mgr1 apps]# systemctl enable grafana-server
[root@ceph-mgr1 apps]# systemctl restart grafana-server
10.4.2 登陆 grafana
账号admin 密码 admin
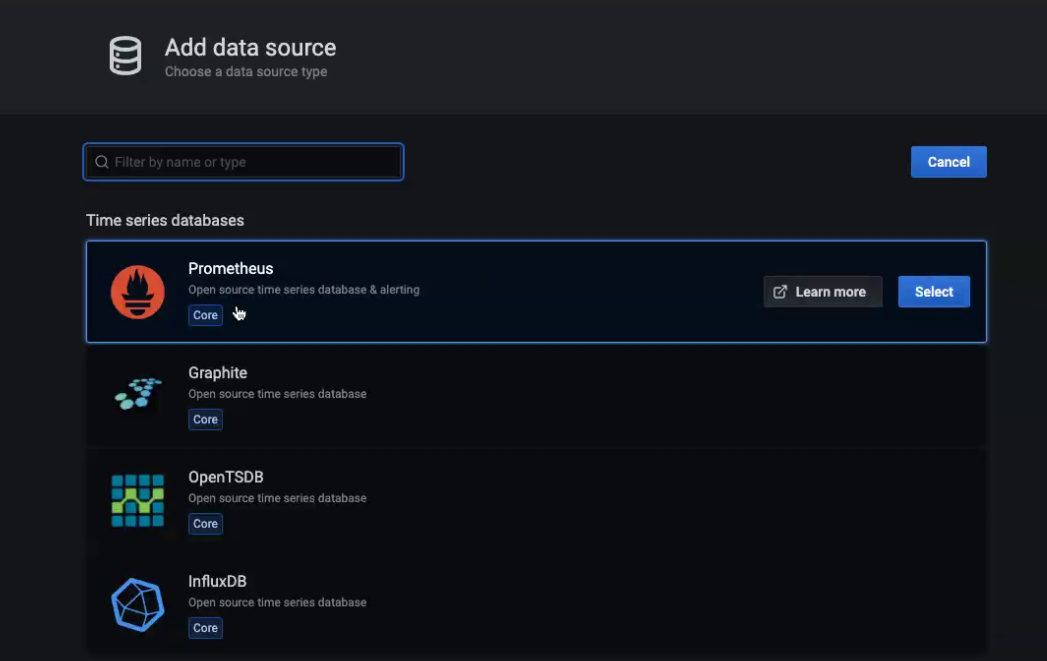
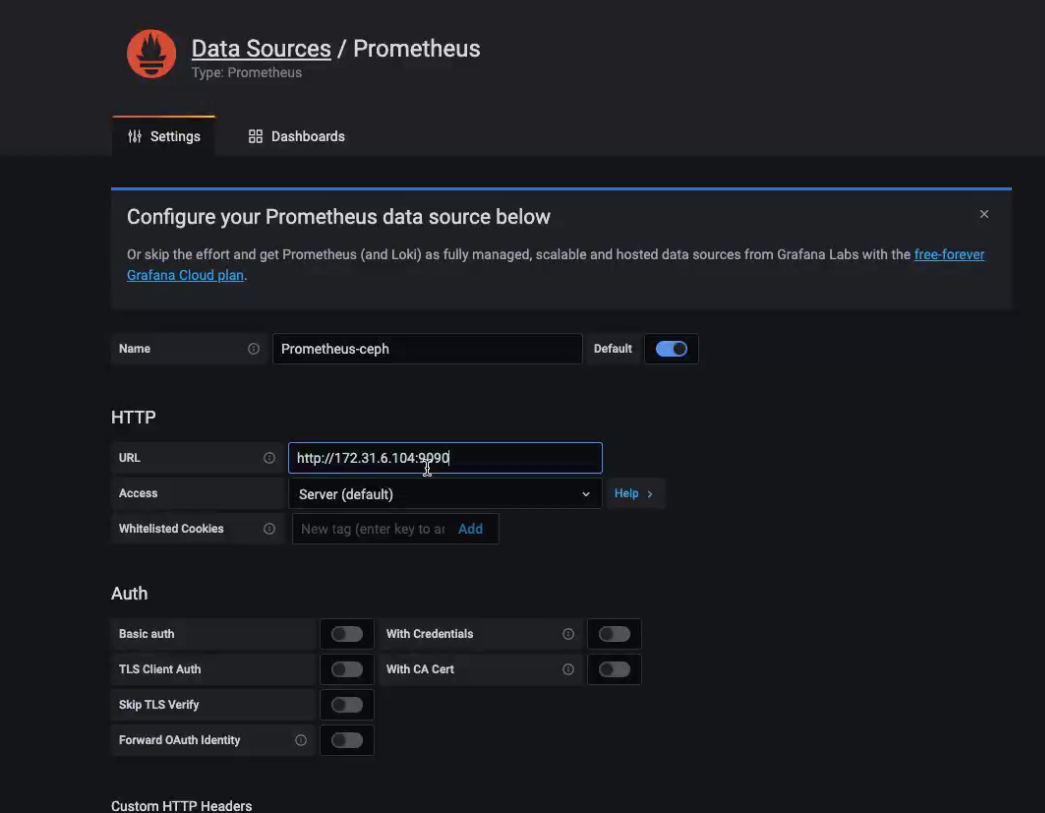
10.4.3 添加数据源
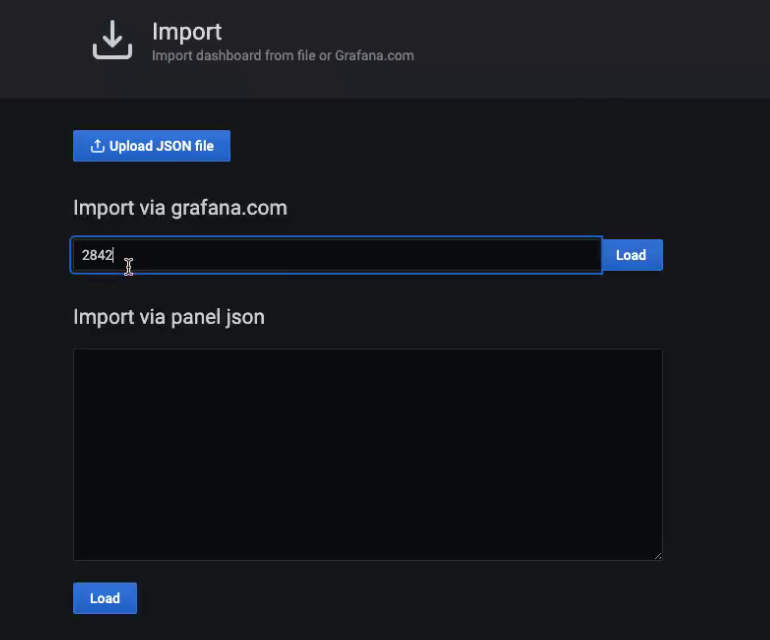
10.4.4 导入模板
ceph OSD
https://grafana.com/grafana/dashboards/5336
ceph pool
https://grafana.com/grafana/dashboards/5342