1.Prometheus 基础
一、Prometheus 简介
在 Kubernetes 中,监控是确保系统正常运行不可或缺的功能,尤其对于庞大的系统如 Kubernetes,监控报警更是至关重要。我们需要时刻了解系统各种运行指标,以及 Pod 的各种指标,并在出现问题时及时收到报警通知。
在早期版本中,Kubernetes 使用了 heapster、influxDB 和 grafana 的组合来监控系统,但在现在的版本中,heapster 已被移除。目前更流行的监控工具是 Prometheus,它是 Google 内部监控报警系统的开源版本,是 Google SRE 思想在不断完善中的产物。Prometheus 的存在旨在更快、更高效地发现问题,具有快速接入、简单灵活的配置等优点,而且已经是毕业项目,得到了 CNCF 的支持。
Prometheus 最初是由 SoundCloud 构建的开源系统监控和报警工具。它于 2016 年加入了 CNCF 基金会,成为继 Kubernetes 之后的第二个托管项目。相较于其他传统监控工具,Prometheus 具有以下几个特点:
- 多维数据模型:使用多维数据模型,通过 metric 名称和键/值对标识时间序列数据。
- 灵活的查询语言: 提供了灵活强大的查询语言,使用户能够轻松地进行数据分析和查询。
- 本地存储: 不依赖分布式存储,只与本地磁盘有关。
- 服务拉取模式:通过 HTTP 的服务拉取方式获取时间序列数据,这种模式使得数据采集更加灵活和可控。
- 支持推送模式: 除了拉取模式,还支持推送模式,允许用户通过推送的方式添加时间序列数据。
- 目标发现:支持通过服务发现或静态配置的方式发现监控目��标。
- 丰富的图形和仪表板支持: 提供了多种图形和仪表板支持,使用户能够直观地监控和分析系统的运行状态。
1.1 Prometheus 组件
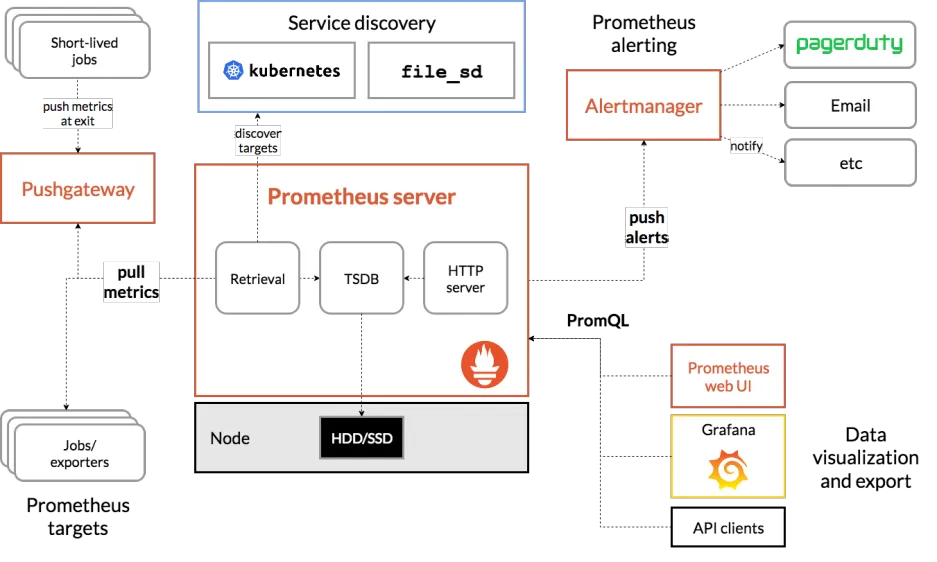
Prometheus 由多个组件组成,但是其中有些组件是可选的:
- Prometheus Server:用于抓取指标数据并存储时间序列数据,是 Prometheus 的核心组件。
- Exporter:用于暴露指标,允许 Prometheus 服务器抓取。这些指标可以来自于各种不同类型的系统,如数据库、应用程序等。
- Pushgateway: 是一个可选组件,允许客户端通过push 的方式将指标数据推送到该网关,适用于临时性的任务或者短期的作业。
- Alertmanager:用于处理报警的组件,它能够根据配置的规则对触发的报警进行处理,如发送通知、聚合报警等。
Prometheus 可以直接从各种 exporter 或者通过中间的 Pushgateway 获取指标数据,然后将这些数据存储在本地。Prometheus 对这些数据进行规则整理和处理,可以生成聚合数据或者触发报警。最后,Grafana 或者其他可视化工具可以用来展示和分析这些数据,让用户能够更直观地了解系统的运行状态和趋势。
二、Kubernetes 中部署 Prometheus
由于 Prometheus 是 Golang 编写的程序,所以要安装的话也非常简单,只需要将二进制文件下载下来直接执行即可,前往地址:https://prometheus.io/download 下载最新版本即可。
Prometheus 是通过一个 YAML 配置文件来进行启动的,如果我们使用二进制的方式来启动的话,可以使用下面的命令:
$ ./prometheus --config.file=prometheus.yml
其中 prometheus.yml 文件的基本配置如下:
global:
  scrape_interval: 15s
  evaluation_interval: 15s

rule_files:
  # - "first.rules"
  # - "second.rules"

scrape_configs:
  - job_name: prometheus
    static_configs:
      - targets: ["localhost:9090"]
上面这个配置文件中包含了 3 个模块:global、rule_files 和 scrape_configs。
- global 模块控制 Prometheus Server 的全局配置:
- scrape_interval:表示 prometheus 抓取指标数据的频率,默认是 15s,我们可以覆盖这个值
- evaluation_interval:用来控制评估规则的频率,prometheus 使用规则产生新的时间序列数据或者产生警报
- rule_files:指定了报警规则所在的位置,prometheus 可以根据这个配置加载规则,用于生成新的时间序列数据或者报警信息,当前我们没有配置任何报警规则。
- scrape_configs 用于控制 prometheus 监控哪些资源。
由于 prometheus 通过 HTTP 的方式来暴露的它本身的监控数据,prometheus 也能够监控本身的健康情况。在默认的配置里有一个单独的 job,叫做 prometheus,它采集 prometheus 服务本身的时间序列数据。
这个 job 包含了一个单独的、静态配置的目标:监听 localhost 上的 9090 端口。
prometheus 默认会通过目标的 /metrics 路径采集 metrics。
所以,默认的 job 通过 URL:http://localhost:9090/metrics 采集 metrics。
收集到的时间序列包含 prometheus 服务本身的状态和性能。
如果我们还有其他的资源需要监控的话,直接配置在 scrape_configs 模块下面就可以了。
2.1 创建命名空间
为了方便管理,我们将监控相关的所有资源对象都安装在monitor 这个 namespace 下面,没有的话可以提前创建。
$ kubectl create ns monitor
2.2 Prometheus ConfigMap
为了能够方便的管理配置文件,我们这里将 prometheus.yml 文件用 ConfigMap 的形式进行管理
# prometheus-cm.yaml
apiVersion: v1
kind: ConfigMap
metadata:
  name: prometheus-config
  namespace: monitor
data:
  prometheus.yml: |
    global:
      scrape_interval: 15s
      scrape_timeout: 15s
    scrape_configs:
    - job_name: 'prometheus'
      static_configs:
      - targets: ['localhost:9090']
我们这里暂时只配置了对 prometheus 本身的监控,直接创建该资源对象:
$kubectl apply -f prometheus-cm.yaml
configmap "prometheus-config" created

---
$ kubectl get cm -n monitor
NAME                DATA   AGE
kube-root-ca.crt    1      91s
prometheus-config   1      15s
2.3 prometheus-deploy
现在我们来创建 prometheus 的 Pod 资源:
# prometheus-deploy.yaml
apiVersion: apps/v1
kind: Deployment
metadata:
  name: prometheus
  namespace: monitor
  labels:
    app: prometheus
spec:
  selector:
    matchLabels:
      app: prometheus
  template:
    metadata:
      labels:
        app: prometheus
    spec:
      serviceAccountName: prometheus
      containers:
        - image: registry.cn-hangzhou.aliyuncs.com/xxk8s/prometheus:v2.34.0
          name: prometheus
          args:
            - "--config.file=/etc/prometheus/prometheus.yml"
            - "--storage.tsdb.path=/prometheus" # 指定tsdb数据路径
            - "--storage.tsdb.retention.time=24h"
            - "--web.enable-admin-api" # 控制对admin HTTP API的访问,其中包括删除时间序列等功能
            - "--web.enable-lifecycle" # 支持热更新,直接执行localhost:9090/-/reload立即生效
          ports:
            - containerPort: 9090
              name: http
          volumeMounts:
            - mountPath: "/etc/prometheus"
              name: config-volume
            - mountPath: "/prometheus"
              name: data
          resources:
            requests:
              cpu: 100m
              memory: 512Mi
            limits:
              cpu: 100m
              memory: 512Mi
      volumes:
        - name: data
          persistentVolumeClaim:
            claimName: prometheus-data
        - configMap:
            name: prometheus-config
          name: config-volume
2.4 创建LocalPV 进行数据持久化
为了 prometheus 的性能和数据持久化我们这里是直接将通过一个 LocalPV 来进行数据持久化,通过 --storage.tsdb.path=/prometheus 指定数据目录,创建如下所示的一个 PVC 资源对象,注意是一个 LocalPV,和 node1 节点具有亲和性:
#node01
mkdir -p /data/k8s/prometheus
#prometheus-localpv.yaml
apiVersion: v1
kind: PersistentVolume
metadata:
  name: prometheus-local
  labels:
    app: prometheus
spec:
  accessModes:
    - ReadWriteOnce
  capacity:
    storage: 100Gi
  storageClassName: prometheus-local-storage
  local:
    path: /data/k8s/prometheus
  nodeAffinity:
    required:
      nodeSelectorTerms:
        - matchExpressions:
            - key: kubernetes.io/hostname
              operator: In
              values:
                - node01
  persistentVolumeReclaimPolicy: Retain
---
apiVersion: v1
kind: PersistentVolumeClaim
metadata:
  name: prometheus-data
  namespace: monitor
spec:
  selector:
    matchLabels:
      app: prometheus
  accessModes:
    - ReadWriteOnce
  resources:
    requests:
      storage: 100Gi
  storageClassName: prometheus-local-storage
kubectl get pv
NAME               CAPACITY   ACCESS MODES   RECLAIM POLICY   STATUS   CLAIM                     STORAGECLASS               REASON   AGE
prometheus-local   100Gi      RWO            Retain           Bound    monitor/prometheus-data   prometheus-local-storage            3m46s


kubectl get pvc -n monitor
NAME              STATUS   VOLUME             CAPACITY   ACCESS MODES   STORAGECLASS               AGE
prometheus-data   Bound    prometheus-local   100Gi      RWO            prometheus-local-storage   3m25s
通过标签 "kubernetes.io/hostname" 进行筛选,数据会存放在node01
kubectl get node -l kubernetes.io/hostname=node01
NAME     STATUS   ROLES    AGE   VERSION
node01   Ready    <none>   16h   v1.22.2
2.5 Prometheus ServiceAccount
由于 prometheus 可以访问 Kubernetes 的一些资源对象,所以需要配置 rbac 相关认证,这里我们使用了一个名为 prometheus 的 serviceAccount 对象:
# prometheus-rbac.yaml
apiVersion: v1
kind: ServiceAccount
metadata:
  name: prometheus
  namespace: monitor
---
apiVersion: rbac.authorization.k8s.io/v1
kind: ClusterRole
metadata:
  name: prometheus
rules:
  - apiGroups:
      - ""
    resources:
      - nodes
      - services
      - endpoints
      - pods
      - nodes/proxy
    verbs:
      - get
      - list
      - watch
  - apiGroups:
      - "extensions"
    resources:
      - ingresses
    verbs:
      - get
      - list
      - watch
  - apiGroups:
      - ""
    resources:
      - configmaps
      - nodes/metrics
    verbs:
      - get
  - nonResourceURLs:
      - /metrics
    verbs:
      - get
---
apiVersion: rbac.authorization.k8s.io/v1
kind: ClusterRoleBinding
metadata:
  name: prometheus
roleRef:
  apiGroup: rbac.authorization.k8s.io
  kind: ClusterRole
  name: prometheus
subjects:
  - kind: ServiceAccount
    name: prometheus
    namespace: monitor
由于我们要获取的资源信息,在每一个 namespace 下面都有可能存在,所以我们这里使用的是 ClusterRole 的资源对象,值得一提的是我们这里的权限规则声明中有一个 nonResourceURLs 的属性,是用来对非资源型 metrics 进行操作的权限声明,这个在以前我们很少遇到过,然后直接创建上面的资源对象即可:
kubectl apply -f prometheus-rbac.yaml
serviceaccount "prometheus" created
clusterrole.rbac.authorization.k8s.io "prometheus" created
clusterrolebinding.rbac.authorization.k8s.io "prometheus" created
现在我们就可以添加 promethues 的资源对象了:
kubectl apply -f prometheus-deploy.yaml
deployment.apps/prometheus created


kubectl get pod -n monitor
NAME                         READY   STATUS   RESTARTS     AGE
prometheus-79695df76-rx6dx   0/1     Error    1 (8s ago)   23s


kubectl logs -f prometheus-79695df76-rx6dx -n monitor
ts=2024-03-06T02:01:07.861Z caller=main.go:516 level=info msg="Starting Prometheus" version="(version=2.34.0, branch=HEAD, revision=881111fec4332c33094a6fb2680c71fffc427275)"
ts=2024-03-06T02:01:07.861Z caller=main.go:521 level=info build_context="(go=go1.17.8, user=root@121ad7ea5487, date=20220315-15:18:00)"
ts=2024-03-06T02:01:07.861Z caller=main.go:522 level=info host_details="(Linux 5.4.0-172-generic #190-Ubuntu SMP Fri Feb 2 23:24:22 UTC 2024 x86_64 prometheus-79695df76-rx6dx (none))"
ts=2024-03-06T02:01:07.861Z caller=main.go:523 level=info fd_limits="(soft=1048576, hard=1048576)"
ts=2024-03-06T02:01:07.861Z caller=main.go:524 level=info vm_limits="(soft=unlimited, hard=unlimited)"
ts=2024-03-06T02:01:07.861Z caller=query_logger.go:90 level=error component=activeQueryTracker msg="Error opening query log file" file=/prometheus/queries.active err="open /prometheus/queries.active: permission denied"
panic: Unable to create mmap-ed active query log

goroutine 1 [running]:
github.com/prometheus/prometheus/promql.NewActiveQueryTracker({0x7ffe98d72e01, 0xb}, 0x14, {0x3637a40, 0xc00011b6d0})
        /app/promql/query_logger.go:120 +0x3d7
main.main()
        /app/cmd/prometheus/main.go:569 +0x6049
创建 Pod 后,我们可以看到并没有成功运行,出现了 open /prometheus/queries.active: permission denied 这样的错误信息,这是因为我们的 prometheus 的镜像中是使用的 nobody 这个用户,然后现在我们通过 LocalPV 挂载到宿主机上面的目录的 ownership 却是 root:
root@node01:/tmp# ls -la /data/k8s
total 12
drwxr-xr-x 3 root root 4096 Mar  6 09:47 .
drwxr-xr-x 3 root root 4096 Mar  6 09:47 ..
drwxr-xr-x 2 root root 4096 Mar  6 09:47 prometheus
所以当然会出现操作权限问题了,这个时候我们就可以通过 securityContext 来为 Pod 设置下 volumes 的权限,通过设置 runAsUser=0 指定运行的用户为 root,也可以通过设置一个 initContainer 来修改数据目录权限:
方法1
......
initContainers:
- name: fix-permissions
  image: busybox
  command: [chown, -R, "nobody:nobody", /prometheus]
  volumeMounts:
  - name: data
    mountPath: /prometheus
方法2
    spec:
      serviceAccountName: prometheus
      containers:
        - image: registry.cn-hangzhou.aliyuncs.com/xxk8s/prometheus:v2.34.0
          name: prometheus
          args:
            - "--config.file=/etc/prometheus/prometheus.yml"
            - "--storage.tsdb.path=/prometheus" # 指定tsdb数据路径
            - "--storage.tsdb.retention.time=24h"
            - "--web.enable-admin-api" # 控制对admin HTTP API的访问,其中包括删除时间序列等功能
            - "--web.enable-lifecycle" # 支持热更新,直接执行localhost:9090/-/reload立即生效
          ports:
            - containerPort: 9090
              name: http
          volumeMounts:
            - mountPath: "/etc/prometheus"
              name: config-volume
            - mountPath: "/prometheus"
              name: data
          securityContext: #为容器定义安全上下文,指定运行容器的用户
            runAsUser: 0
这个时候我们重新更新下 prometheus:
kubectl apply -f prometheus-deploy.yaml
deployment.apps/prometheus configured

kubectl get pod -n monitor
NAME                         READY   STATUS        RESTARTS   AGE
prometheus-79695df76-rx6dx   0/1     Terminating   5          3m58s
prometheus-cc4945f67-t4bbt   1/1     Running       0          3s


kubectl logs -f prometheus-cc4945f67-t4bbt -n monitor
ts=2024-03-06T02:04:01.466Z caller=main.go:516 level=info msg="Starting Prometheus" version="(version=2.34.0, branch=HEAD, revision=881111fec4332c33094a6fb2680c71fffc427275)"
ts=2024-03-06T02:04:01.466Z caller=main.go:521 level=info build_context="(go=go1.17.8, user=root@121ad7ea5487, date=20220315-15:18:00)"
ts=2024-03-06T02:04:01.466Z caller=main.go:522 level=info host_details="(Linux 5.4.0-172-generic #190-Ubuntu SMP Fri Feb 2 23:24:22 UTC 2024 x86_64 prometheus-cc4945f67-t4bbt (none))"
ts=2024-03-06T02:04:01.466Z caller=main.go:523 level=info fd_limits="(soft=1048576, hard=1048576)"
ts=2024-03-06T02:04:01.466Z caller=main.go:524 level=info vm_limits="(soft=unlimited, hard=unlimited)"
ts=2024-03-06T02:04:01.660Z caller=web.go:540 level=info component=web msg="Start listening for connections" address=0.0.0.0:9090
ts=2024-03-06T02:04:01.661Z caller=main.go:937 level=info msg="Starting TSDB ..."
2.6 Prometheus SVC
Pod 创建成功后,为了能够在外部访问到 prometheus 的 webui 服务,我们还需要创建一个 Service 对象:
# prometheus-svc.yaml
apiVersion: v1
kind: Service
metadata:
  name: prometheus
  namespace: monitor
  labels:
    app: prometheus
spec:
  selector:
    app: prometheus
  type: NodePort
  ports:
    - name: web
      port: 9090
      targetPort: http
      nodePort: 30090
为了方便测试,我们这里创建一个 NodePort 类型的服务,当然我们可以创建一个 Ingress对象,通过域名来进行访问:
kubectl apply -f prometheus-svc.yaml
service/prometheus created

kubectl get svc -n monitor
NAME         TYPE       CLUSTER-IP      EXTERNAL-IP   PORT(S)          AGE
prometheus   NodePort   10.99.254.163   <none>        9090:30090/TCP   14s
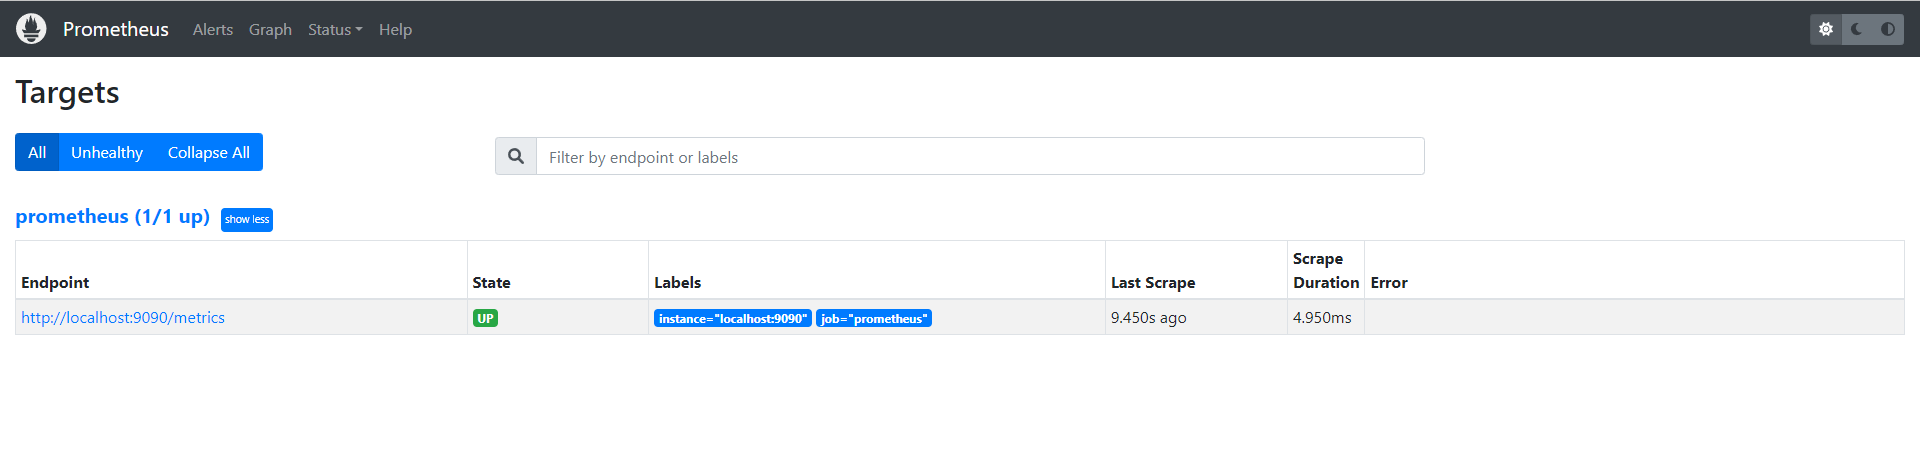
现在我们就可以通过 http://任意节点IP:30090 访问 prometheus 的 webui 服务了:
现在我们可以查看当前监控系统中的一些监控目标(Status -> Targets):
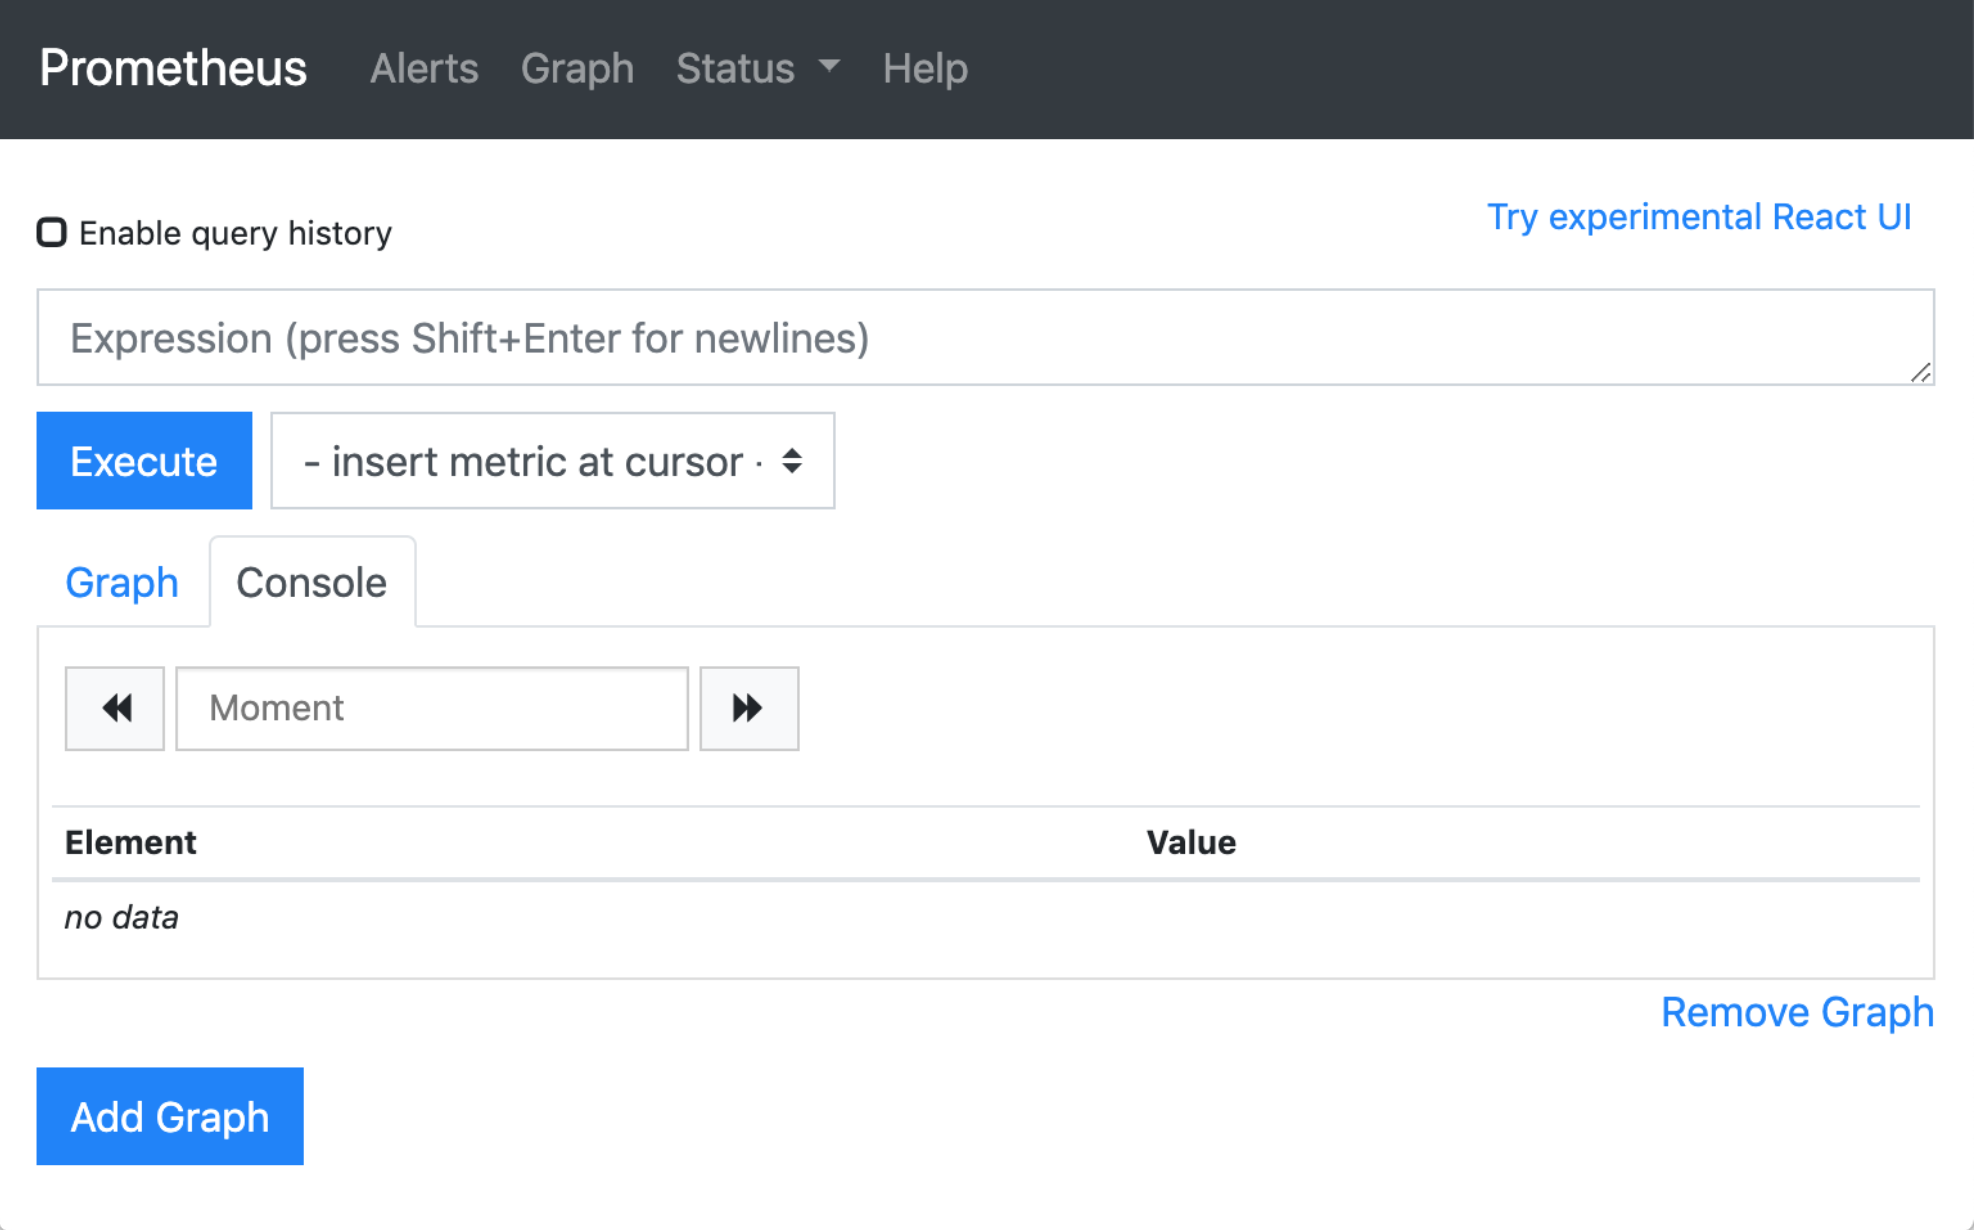
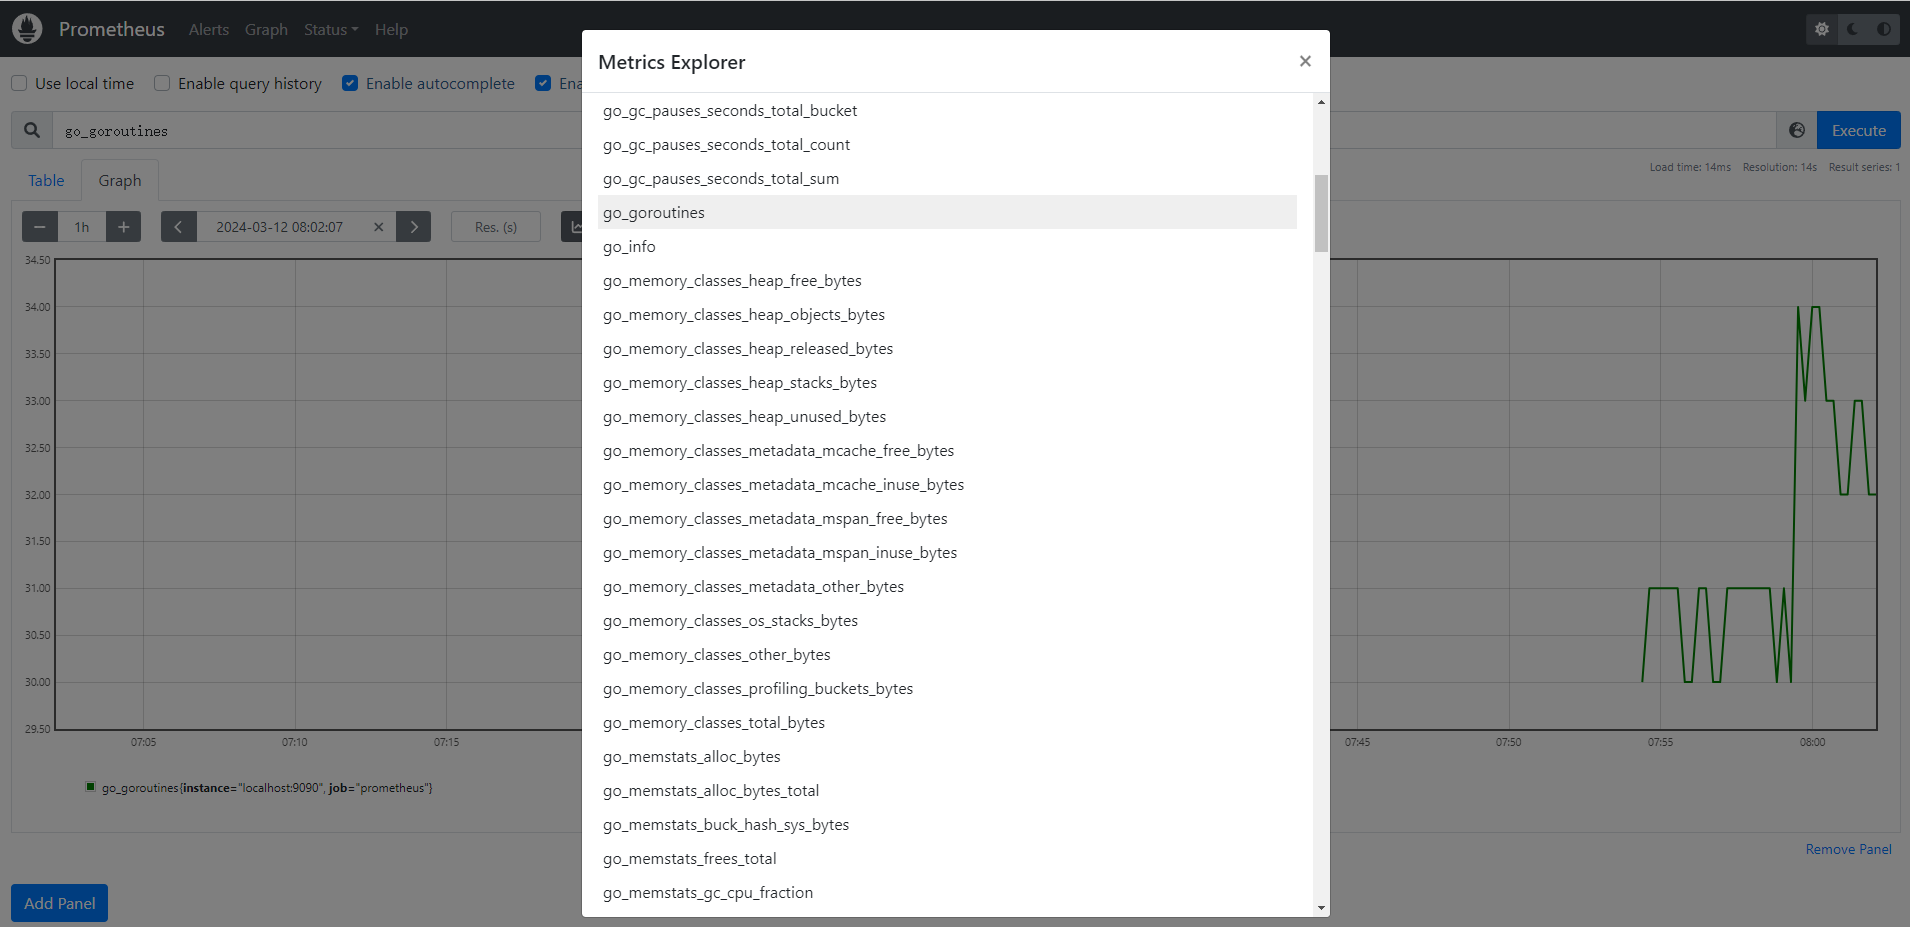
由于我们现在还没有配置任何的报警信息,所以 Alerts 菜单下面现在没有任何数据,隔一会儿,我们可以去 Graph 菜单下面查看我们抓取的 prometheus 本身的一些监控数据了,其中 **- insert metrics at cursor -**下面就有我们搜集到的一些监控指标数据:
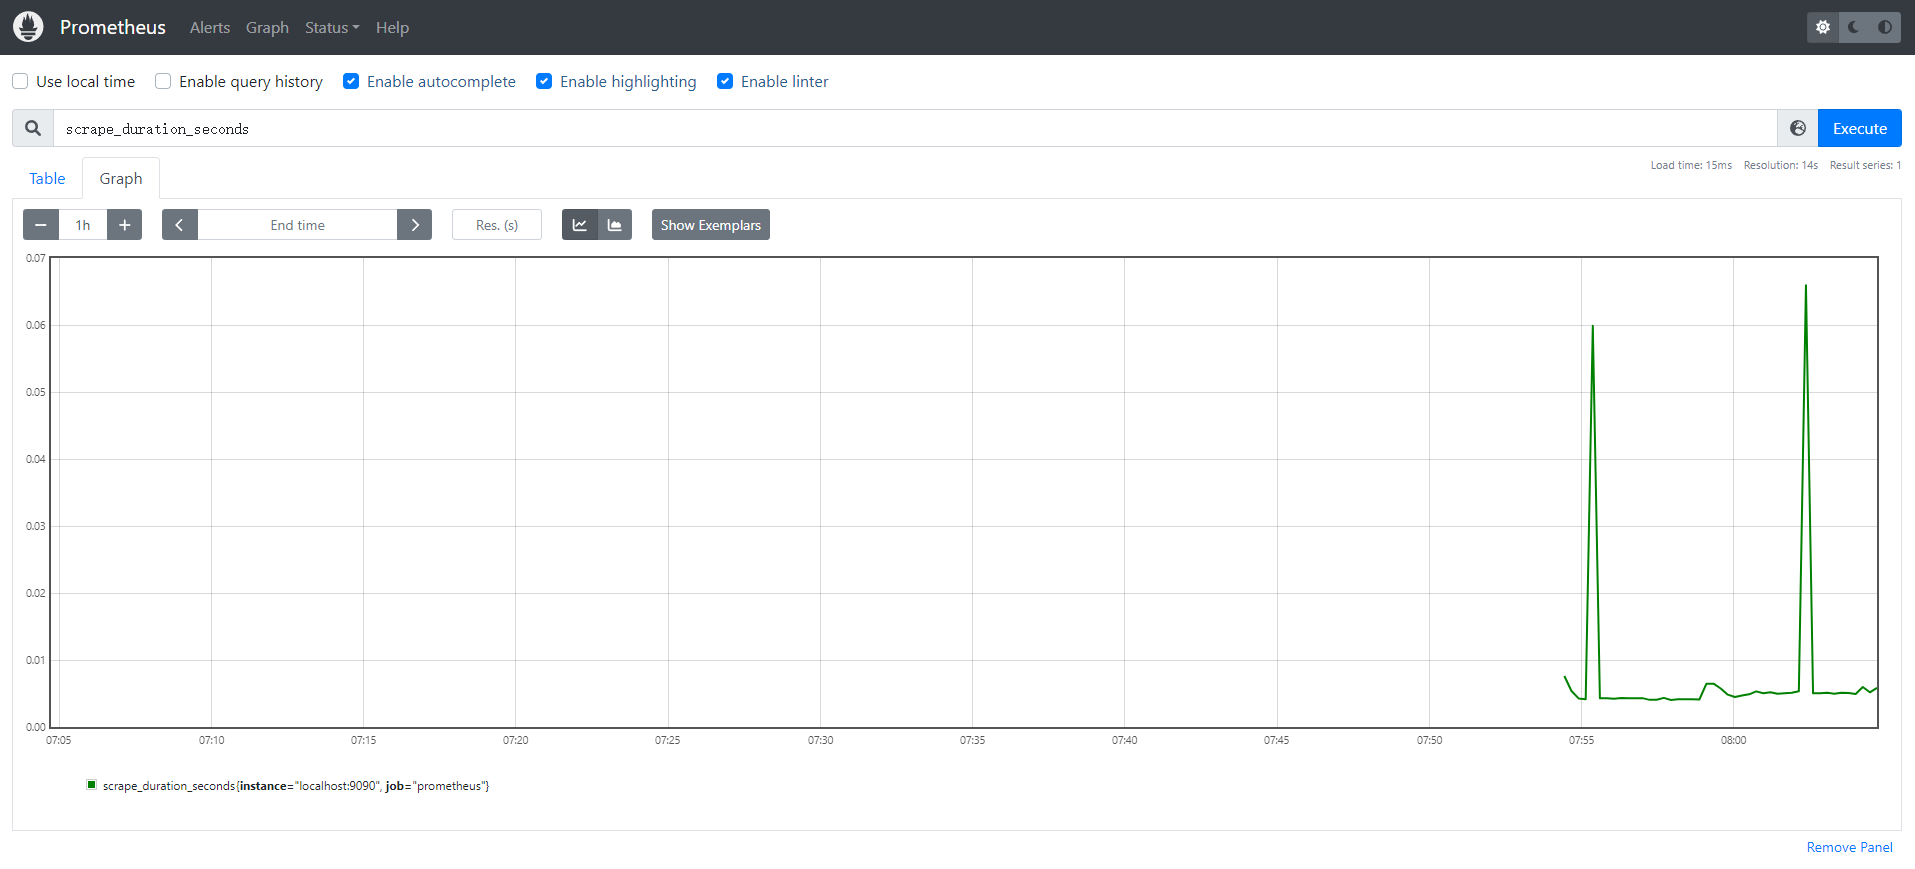
比如我们这里就选择 scrape_duration_seconds 这个指标,然后点击 Execute,就可以看到类似于下面的图表数据了:
除了简单的直接使用采集到的一些监控指标数据之外,这个时候也可以使用强大的 PromQL 工具,PromQL 其实就是 prometheus 便于数据聚合展示开发的一套 ad hoc 查询语言的,你想要查什么找对应函数取你的数据好了。